


Over the past two decades, GPUs have evolved well beyond their original purpose of rendering pixels on a screen. Today, they’re powerful parallel processors at the heart of many tech-fields: graphics, computer vision, simulations, signal processing, bioinformatics, and—of course—AI and machine learning. Because of this, understanding how GPUs work and how to use them efficiently has become a valuable skill for any programmer.
In this article, I’d like us to explore how GPUs work from the ground up—from SIMD units to real GPU architectures—and learn how to program, debug, and profile the code that runs on them. This is (hopefully) a beginner-friendly tutorial, with occasional deep dives into technical details. We’ll be using CUDA and NVIDIA architectures for the examples, but the concepts apply to other platforms as well.
Table of Contents
- Brief Introduction to GPUs
- GPU Programming Overview
- Vector Addition Example
- GPU Architectures
- Resources
Brief Introduction to GPUs
Explaining exactly what a GPU is isn’t that easy—just too many layers of metal and silicon to uncover 😄— but the main idea is simple: GPUs excel at executing many instructions simultaneously. One of the easiest ways to picture this is by comparing them to something you’re already familiar with—the CPU.

CPU vs GPU
We can think of it like this:
A CPU usually comes with only a few powerful cores, each able to execute any type of instruction the hardware supports. A GPU, on the other hand, is packed with thousands of smaller cores, all designed to work in parallel. That’s what makes GPUs so good at handling thousands of tasks simultaneously.
To give you an idea, Ryzen Zen 4 CPU might have 6 cores, while NVIDIA’s Ada architecture packs in over 16,384 CUDA cores plus 512 Tensor Cores. (Note: NVIDIA chip is also 9 times bigger than the Ryzen CPU, but the difference is still huge)
Now, comparing CPU cores to GPU cores isn’t exactly fair. They’re designed for very different purposes. A CPU core is usually much more complex, capable of juggling a wide range of tasks—from running the operating system to handling input/output operations. GPU cores, on the other hand, are generally simpler and often specialized for specific kinds of calculations—like NVIDIA’s Tensor Cores, which are built specifically to accelerate AI and machine learning workloads.
Another important distinction is in how GPU cores are organized. GPUs typically follow a SIMD (Single Instruction, Multiple Data) model, meaning that many cores execute the same instruction at the same time, but on different pieces of data. This is perfect for problems like graphics or matrix math, where you need to repeat the same calculation over and over across huge datasets. We will talk a bit more in depth about this topic in the following sections but for now let’s focus on how GPUs are actually used.
GPU Programming Overview
What we, as programmers, want is to execute work on GPUs. But GPUs don’t operate on their own —the CPU acts as the control station, orchestrating the flow. Basically, the CPU sends commands to the GPU, and the GPU executes those commands across its many cores.

CPU sends commands
To make this workflow possible, hardware vendors provide different APIs. Before 2006, the main way to program GPUs was through graphics APIs like OpenGL or Direct3D, which required thinking any problem to solve in terms of graphical tasks (a concept also known as GPGPU). Then NVIDIA introduced CUDA, allowing programmers to use GPUs for general-purpose computation. Around the same time, other platforms emerged: OpenCL (2009) provided a cross-vendor framework for writing code that runs on GPUs from different manufacturers, while AMD’s ROCm offers a similar platform for AMD GPUs.
For the rest of this article, I’ll focus on CUDA, but the concepts are similar in other environments. You can find some alternatives listed at the bottom of this page.
Introduction to CUDA
CUDA is more than just a driver and an API for programming GPUs. It’s a complete development platform that gives you the tools and libraries needed to write, profile, optimize and run code on NVIDIA GPUs.
To get started with CUDA, the easiest approach is to follow NVIDIA’s official installation guide here. It will walk you through all the necessary steps.
System Requirements
| Requirement | Description |
|---|---|
| GPU | CUDA-capable NVIDIA GPU |
| OS | Supported version of Microsoft Windows |
| IDE | Supported version of Microsoft Visual Studio |
| Driver | NVIDIA driver |
Setting Up CUDA on Windows
- Go to NVIDIA’s CUDA downloads page (at the moment of writing, the latest available version is CUDA 13.0)
- Select your windows version and download the toolkit
- Run the installer. I recommend installing all components (including Nsight Compute, Visual Studio integration, etc.) so you have the full set of tools available
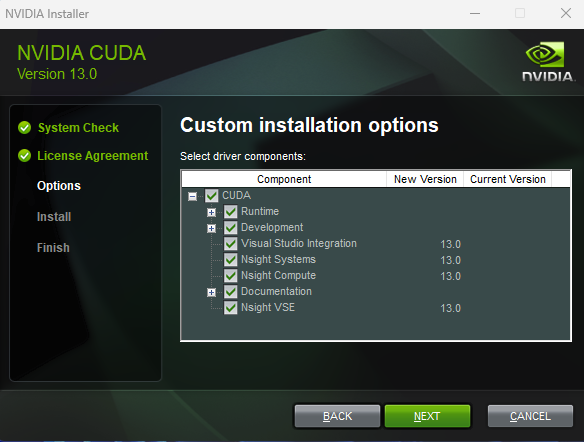
CUDA Installer Setup
- By the end of the installation you will be able to see the list of components that have been installed. As you can see there are lots of them, a lot of libraries, tools for profiling and the most important of them: NVCC, Nvidia CUDA Compiler
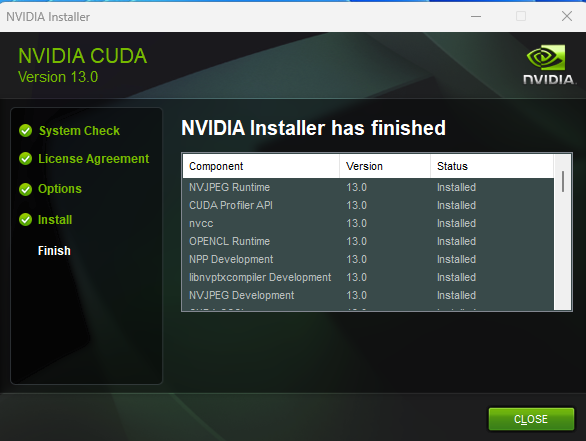
CUDA Installer Setup
At this point, you should be able to run nvcc --version in a terminal and get the CUDA version installed.
nvcc –version
nvcc: NVIDIA (R) Cuda compiler driver
Copyright (c) 2005-2025 NVIDIA Corporation
Cuda compilation tools, release 13.0, V13.0.48
The CUDA Compiler (NVCC)
One nice feature of CUDA is that you can write both CPU and GPU code in the same file, using the same programming language, that in contrast to graphics APIs, where you usually have to separate shaders from application code.
The CUDA Compiler (nvcc) is NVIDIA’s tool for building CUDA programs. Its job is to take your source code, separate the CPU parts from the GPU parts, and compile them with the appropriate compiler. The CPU (also called the host) is compiled with your regular system compiler (like GCC or MSVC), while the GPU (the device) is compiled with NVIDIA’s owned compiler.
// hello.cu
#include <stdio.h>

// Code that runs on the GPU
__global__ void my_gpu_kernel() {
    printf("Hello from the GPU!\n");
}

// Code that runs on the CPU
int main() {
    // Call the GPU function
    my_gpu_kernel<<<1>>>();
    return 0;
}
You can compile the code by running:
nvcc hello.cu -o hello
How NVCC works under the hood
When you compile a CUDA program with nvcc, it goes through several stages to handle the CPU and GPU parts of your code.
- NVCC preprocesses the GPU-specific code (the device code) and compiles it into a CUDA binary (cubin) or PTX intermediate code. These binaries are packaged into a fat binary, which can contain multiple GPU architectures in one file.
- The entire program is preprocessed again for the CPU (host) and compiled with the system’s native compiler.
- The fat binary containing the GPU code is embedded into the host code, generating a final host object.
For simplicity, for the rest of this article, we’ll use Microsoft Visual Studio as our development environment, but you can always compile directly with nvcc — Visual Studio does the same thing behind the scenes.
Hello, GPU
If you open Visual Studio, you should see the option to create a CUDA project—let’s go ahead and select that.
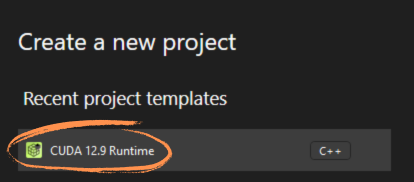
Visual Studio Project Template
By default, Visual Studio will generate a sample CUDA program for you, but to keep things simple, we’ll start from scratch and leave only the main function.
#include <iostream>

int main() {
    std::cout << "Hello from CPU!\n";
    return 0;
}
Build and run the program, and you should see the message “Hello from CPU!” in your console—amazing!
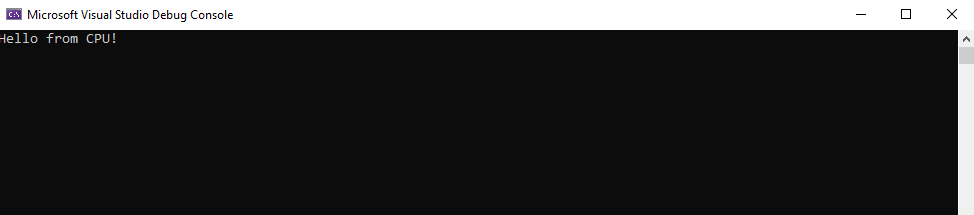
CPU output
If we take a closer look at what Visual Studio does under the hood when you compile the project, you’ll see that it simply calls nvcc with a set of arguments.
nvcc.exe kernel.cu -o kernel.cu.obj -ccbin HOST_COMPILER_PATH -gencode=arch=compute_75,code=\"sm_75,compute_75\"

-o        // Specifies the output file name.
-ccbin    // Tells nvcc which C++ compiler to use for compiling the CPU (host) code
-gencode  // This flag tells nvcc which GPU architectures to target.
          // arch=compute_75 → The compute capability of the GPU you want to target (here, Turing architecture, e.g., RTX 20 series).
PS: If we know which architecture we’re targeting (eg: Ada, Maxwell, Hopper, etc.), we can adjust these flags to take full advantage of the capabilities that the architecture supports.
The key takeaway is that nvcc separates CPU and GPU code and prepares the GPU code to run on the appropriate architecture. But how do we actually tell CUDA what code is going to run on the GPU?
Defining CUDA Kernels
That’s where “CUDA kernels” come into play. Kernels are functions that run on the GPU, and in CUDA we mark them with the __global__ keyword.
__global__ void my_gpu_kernel() {
    printf("Hello from GPU!\n");
}
Marking a function with __global__ tells nvcc that it’s a kernel—code meant to run on the GPU. Inside the kernel, you simply write the instructions you want the GPU to execute.
Launching Work on the GPU
To tell the GPU to execute these kernel, we simply call the kernel by its name, using the special CUDA launch syntax <<< , >>>. For now, let’s keep it simple and just pass “1” inside the brackets. We’ll dive deeper in a moment to see why this syntax is important and how it controls the execution of your GPU code.
#include <iostream>

__global__ void my_gpu_kernel() {
    printf("Hello from GPU!\n");
}

int main() {
    // Launch kernel on the GPU
    my_gpu_kernel <<<1>> > ();

    std::cout << "Hello from CPU!\n";
    return 0;
}
Believe it or not, that’s it! The my_gpu_kernel function runs on the GPU. If you build and run the project, you should see two messages printed in the console:
Hello from the CPU!
Hello from GPU!
Printing on the GPU, under the hood.
Of course, the GPU can’t directly print to the console. GPU printf statements are captured and buffered by the CUDA at runtime. The actual output is sent back to the host (CPU) and displayed in the console when the GPU completes its work.
Note: The order of the messages might vary. The GPU executes asynchronously by default, which means the CPU can continue running while the GPU is still working. Using cudaDeviceSynchronize() ensures the CPU waits for the GPU to finish before moving to the next instruction.
Profiling and Debugging with NVIDIA Nsight
You don’t have to take my word for it—we can actually verify that our code runs on the GPU using NVIDIA Nsight Compute. This tool, installed with the CUDA toolkit, lets us profile and debug GPU kernels to see exactly what’s happening on the GPU.
Setting it up is pretty simple: open Nsight Compute, click the Start Activity button, locate your executable, choose an output file, and then launch the profiling session.
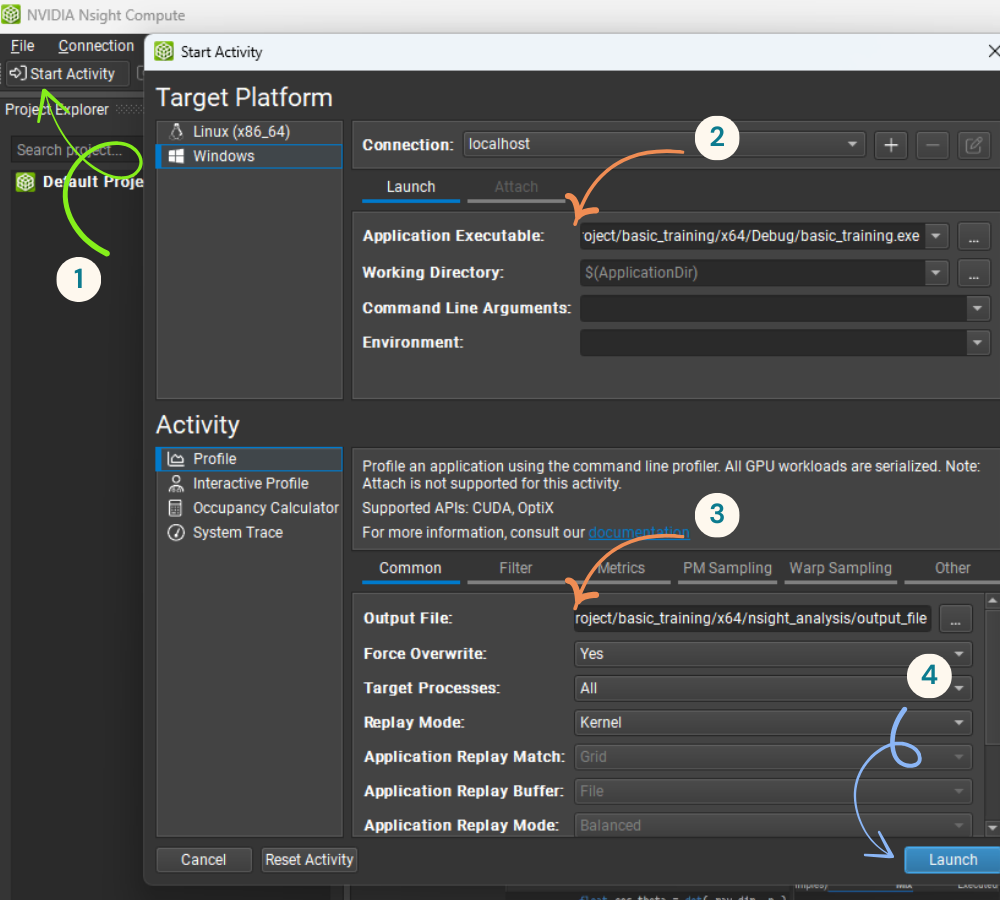
Setup NVIDIA Nsigh Compute
The main panel will show all the GPU function calls (kernels) executed on the GPU. In our case, there’s just a single kernel running: my_gpu_kernel.
For each kernel, you can find useful information such as how long it took to execute (22 microseconds in my case), how many threads were launched, and more.
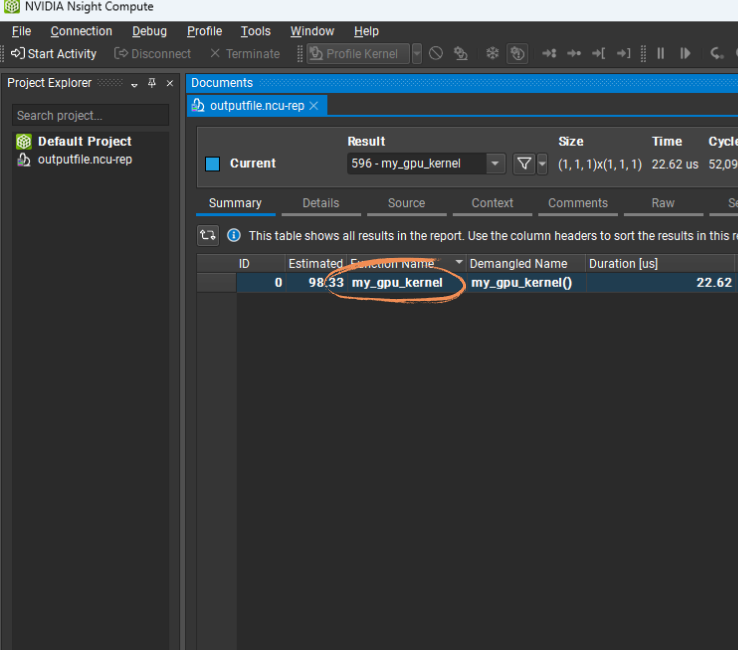
Kernels that run on the GPU
You can also inspect the assembly code (PTX or SASS) for each kernel by double-clicking the kernel in the main panel. This lets you view the high-level C code we wrote side by side with the PTX/SASS intermediate code that nvcc generated.
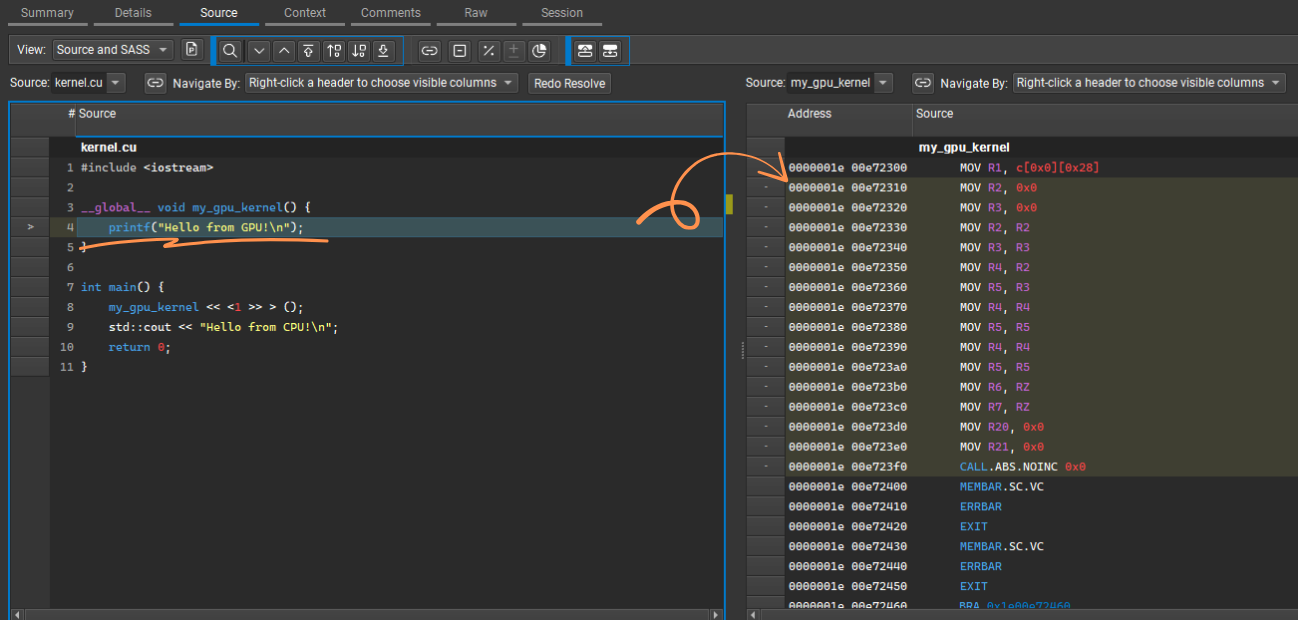
GPU Assembly
We’ll explore NVIDIA Nsight Compute in more depth in future posts, so for now it’s enough to know you can use it to measure and inspect GPU kernel execution.
Steps to Run CUDA Kernels
Let’s wrap up what we need to do to execute code using CUDA:
- Define a kernel with
__global__ - Launch it with
<<<>>>from the host code - Compile the code using nvcc
- Run
Source code:
#include <stdio.h>

// A simple GPU kernel
__global__ void helloGPU() {
    printf("Hello from the GPU!\n");
}

int main() {
    // Launch the GPU kernel
    helloGPU<<<1>>>();

    // Wait for GPU to finish
    cudaDeviceSynchronize();

    // CPU code
    printf("Hello from the CPU!\n");

    return 0;
}
Vector Addition Example

Vector addition example
Now, let’s talk about a real problem. We will start with a basic, the most common operation on the internet: the addition of 2 vectors on the GPU. We have 2 input vectors: A and B and we want C = A + B.
The code can look like this:
// Kernel: iterate over all elements, add them together
__global__ void vectorAdd(const int* A, const int* B, int* C, int N) {
    for (int i = 0; i < N; i++) {
        C[i] = A[i] + B[i];
    }
}
You can notice that the function takes as arguments the 3 arrays that we need A, B, and C, as well as the number of elements N.
But there’s a problem we need to solve first: this kernel will run on the GPU, and the GPU has its own VRAM memory. It can’t directly access data stored in the CPU’s main RAM.
So, before we can run our kernel, we need to allocate memory for the three vectors in the GPU’s VRAM and copy the input data over.
Allocating GPU Memory
To allocate memory on the GPU, CUDA provides the cudaMalloc function. The concept is simple: you tell CUDA how many bytes you need, and it gives you back a pointer to that space in the GPU’s memory.

CUDA Malloc
The function definition looks like:
cudaError_t cudaMalloc(void** devPtr, size_t size);
// devPtr   → adress of a pointer where the device memory address will be stored
// size     → the number of bytes to allocate
In our case, what we need to do is:
int* d_A, *d_B, *d_C;

// Allocate space for the input and output vectors on the GPU, N is the number of elements
cudaMalloc((void**)&d_A, N * sizeof(int));
cudaMalloc((void**)&d_B, N * sizeof(int));
cudaMalloc((void**)&d_C, N * sizeof(int));
This allocates space in the GPU memory and stores the device pointers in d_A, d_B and d_C.
We can now use these pointers and pass them to the kernel when executing it.
int main() {
  // Launch the GPU kernel
+ vectorAdd<<<1>>>(d_A, d_B, d_C, N);

}
Freeing the allocated memory
After you’re done using GPU memory, it’s important to free it to avoid memory leaks. The CUDA counterpart to malloc is cudaFree, which releases memory previously allocated with cudaMalloc.
Copying Data to the GPU
We’ve allocated memory on the GPU for our input vectors, but that memory isn’t initialized yet. We just allocated it, we haven’t set it. So, what we will need to do is to send the input data from the CPU over to the GPU.
CUDA provides the cudaMemcpy function for this purpose. It copies data between host (CPU) and device (GPU) memory. It looks like this:
cudaError_t cudaMemcpy(void* dst, const void* src, size_t count, cudaMemcpyKind kind);
// dst    → destination pointer
// src    → source pointer
// count  → number of bytes to copy
// kind   → direction of the copy, e.g., cudaMemcpyHostToDevice or cudaMemcpyDeviceToHost (CPU to GPU or GPU to CPU)
For our vector addition example, we can copy the input vectors like this:
// Copy input vectors from host to device
// h_A and h_B are the CPU-allocated vectors, holding the data we want
cudaMemcpy(d_A, h_A, N * sizeof(int), cudaMemcpyHostToDevice);
cudaMemcpy(d_B, h_B, N * sizeof(int), cudaMemcpyHostToDevice);
Now the GPU memory holds the actual input data, ready for our kernel to use.
Vector Addition Kernel (Single Thread, 1M Elements)
Let’s now put everything together:
#include <iostream>
#include <cuda_runtime.h>

// GPU kernel: single thread iterates over all elements
__global__ void vectorAdd(const int* A, const int* B, int* C, int N) {
    for (int i = 0; i < N; i++) {
        C[i] = A[i] + B[i];
    }
}

int main() {
    int N = 1024000;  // number of elements
    size_t size = N * sizeof(int);

    // Host arrays
    int* h_A = new int[N];
    int* h_B = new int[N];
    int* h_C = new int[N];

    // Initialize input vectors
    for (int i = 0; i < N; i++) {
        h_A[i] = i;
        h_B[i] = i * 2;
    }

    // Device pointers
    int *d_A, *d_B, *d_C;

    // Allocate GPU memory
    cudaMalloc((void**)&d_A, size);
    cudaMalloc((void**)&d_B, size);
    cudaMalloc((void**)&d_C, size);

    // Copy input data to GPU
    cudaMemcpy(d_A, h_A, size, cudaMemcpyHostToDevice);
    cudaMemcpy(d_B, h_B, size, cudaMemcpyHostToDevice);

    // Launch kernel
    vectorAdd<<<1>>>(d_A, d_B, d_C, N);

    // Copy result back to host
    cudaMemcpy(h_C, d_C, size, cudaMemcpyDeviceToHost);

    // Free GPU memory
    cudaFree(d_A);
    cudaFree(d_B);
    cudaFree(d_C);

    return 0;
}
Awesome! Build & run and you should get the addition of 1 Million elements on the GPU.
CUDA Debugger
Now, if you want to verify that the results are correct, there are a couple of options:
- Copy the results back to the CPU and inspect the values of vector C, in Visual Studio or output it to the console
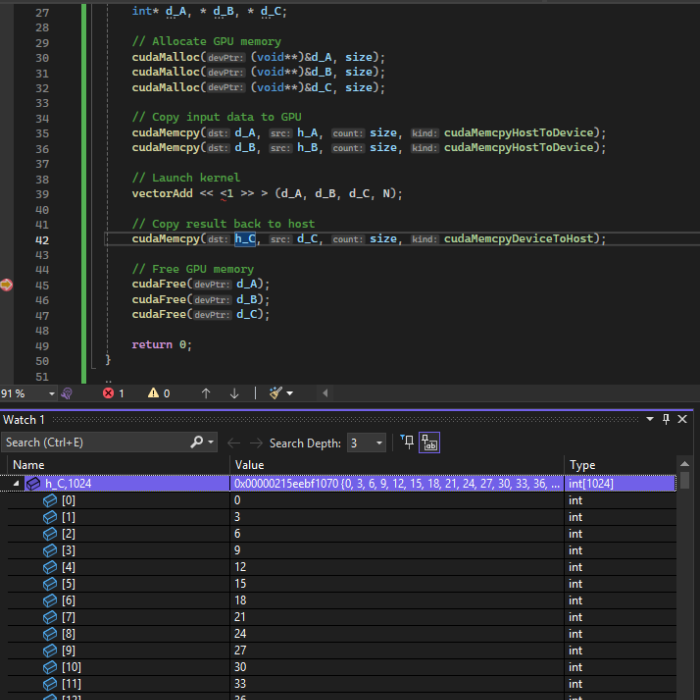
C++ Debugging
- Or, use the NVIDIA Nsight CUDA Debugger, which integrates into Visual Studio when you install the CUDA toolkit
To set it up in Visual Studio:
- Go to Build → Rebuild Solution (for your project)
- Add a breakpoint in your kernel
- Go to Extensions → Nsight → Start CUDA Debugging
That’s it. You can inspect the local variables in the Locals window and visualize GPU memory in Memory Window (Deubg → Windows → Memory → Memory View).
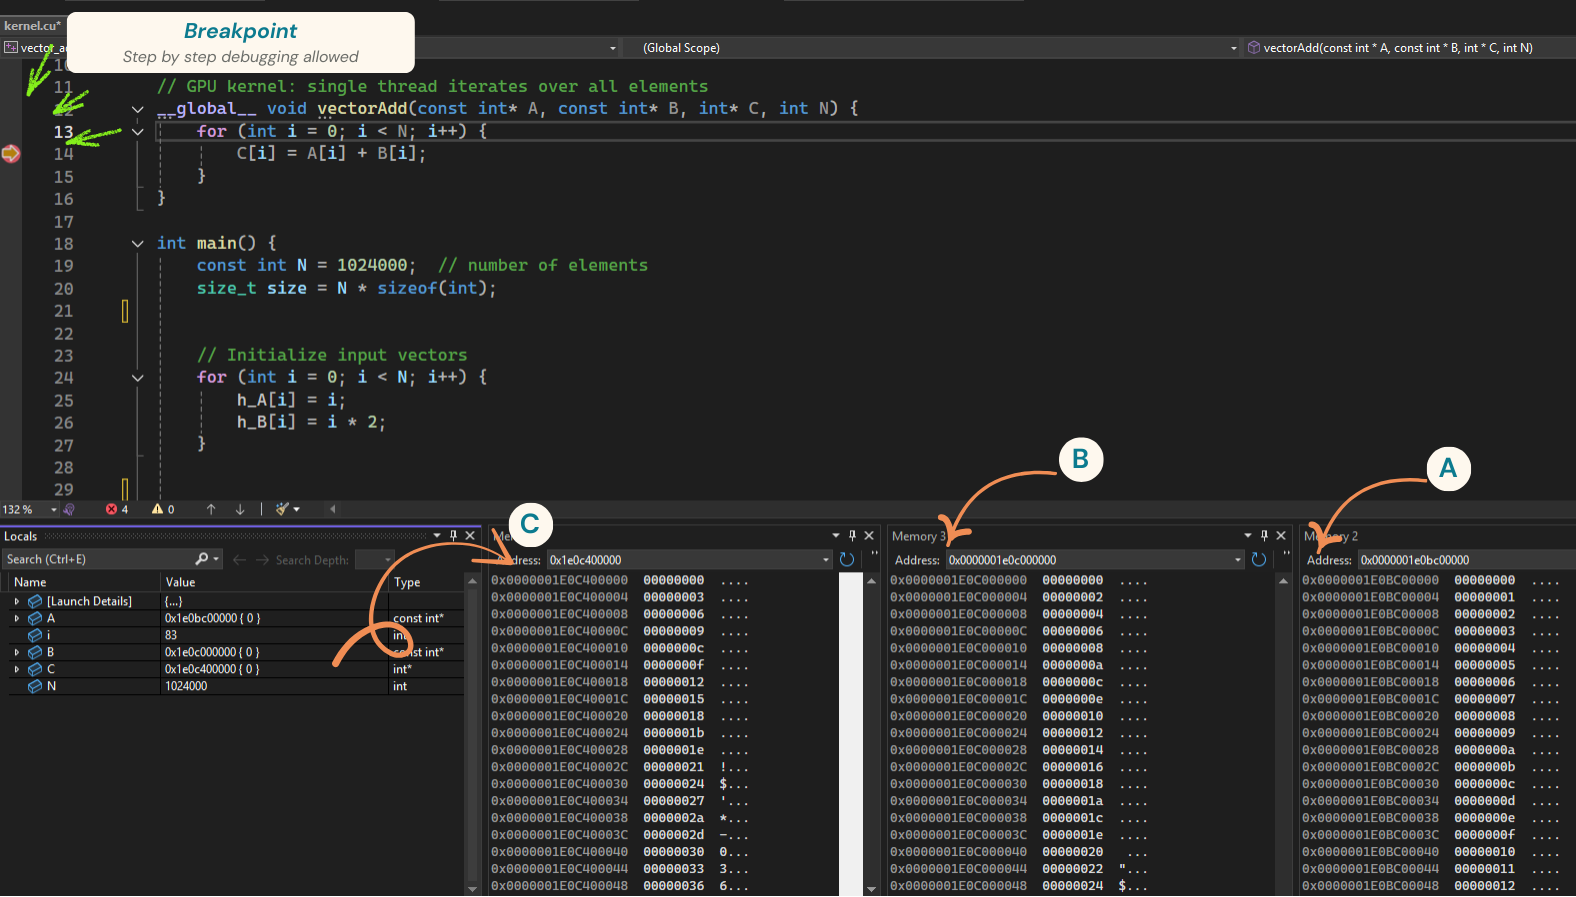
CUDA Debugger
In the above screenshot I added a breakpoint in the kernel and stepped through a few elements. In the Memory window at the bottom, you can see the values of vectors A, B, and C—correctly showing the sum of A and B. For readability, I configured the memory views to display 1 element per column and to interpret memory as 4-byte integers.
Note: you can drag and drop an address from the Locals window into the Memory window to directly inspect the memory region that interests you.
The Nsight CUDA Debugger can do much more than that: you can inspect SASS assembly, view warp registers, monitor thread states, and more. We’ll soon see these “advanced features” in practice.
If you want to find out more about it, check out the official docs: NVIDIA Nsight Visual Studio Edition – CUDA Debugger.
CUDA Error checking
It’s important to check for errors after launching kernels or calling CUDA runtime APIs. Otherwise, your program might silently fail without telling you why. CUDA provides a mechanism to report errors. Here’s a simple pattern you can use for that:
  #define CUDA_CHECK(err) \
    if (err != cudaSuccess) { \
        printf("CUDA Error: %s (at %s:%d)\n", cudaGetErrorString(err), __FILE__, __LINE__); \
        exit(EXIT_FAILURE); \
    }

  int main() {
    // Allocate memory
    CUDA_CHECK(cudaMalloc(&d_a, 10 * sizeof(int)));

    // Launch kernel
    my_gpu_kernel<<<1>>>();

    // Check for kernel launch errors
    CUDA_CHECK(cudaGetLastError());
  }
That being said, this type of error checking isn’t perfect. It doesn’t tell you anything about runtime issues in your GPU code (like out-of-bounds memory access, race conditions, or performance bottlenecks). It only checks CUDA API calls. There are other tools (such as NVIDIA Nsight, Compute Sanitizer, or cuda-memcheck) that can help us identify and debug GPU-specific issues—but we’ll cover those in future posts.
Measuring GPU Code Performance
Let’s see how much time it takes to calculate the sum of our 1 million elements. For profiling, you can use Nsight Compute (as we did earlier) and check the duration of each kernel.
In my case, Nsight Compute reports 50ms (50!!!).
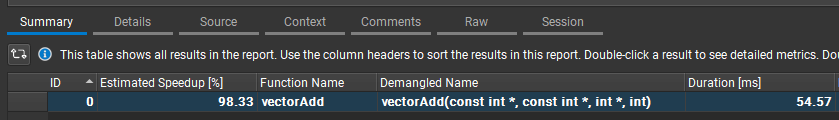
Vector Add Kernel Duration
CUDA also offers a way to record events, which work kind of like C++’s chrono library. The idea is simple: you create two events, sandwich your kernel launch between them, and then measure the elapsed time.
cudaEvent_t start, stop;
cudaEventCreate(&start);
cudaEventCreate(&stop);

// Record Start
cudaEventRecord(start);

// Launch kernel
vectorAdd<<<1>>>(d_A, d_B, d_C, N);

// Record End
cudaEventRecord(stop);
cudaEventSynchronize(stop);

// Calculate the elapsed time
float milliseconds = 0;
cudaEventElapsedTime(&milliseconds, start, stop);

printf("Kernel execution time: %f ms\n", milliseconds);
So now we have two ways of timing the kernel:
- Nsight Compute, which gives us detailed profiling info
- CUDA events, which give us just the raw elapsed time
Note: the two don’t show the same kind of information. Nsight gives you a detailed info (like memory transfers, stalls, etc.), while events only measure the time between two points.
Going back to numbers: It takes ~50 ms to add 1 million elements on the GPU. That’s a lot. I did the same operation on the CPU and it took around 1 ms.
So, why the huge difference?
Well… the answer lies in the fact that we’re only using a single GPU core, we are doing all the work on a single thread. That’s a complete waste of GPU computation power. (It also highlights the difference between a CPU core and a GPU core—as we discussed earlier, they’re designed for very different workloads.)
Launching Multiple Threads, CUDA Thread Hierarchy
So, instead of wasting all that parallel power with just one thread, we can launch many threads at once. In our case: we can launch 1 Million threads and map one thread to an element (C[i] = A[i] + B[i]).

Multiple threads
This way, instead of one thread looping over a million elements, we’ll have a million threads, each doing a single addition.
In CUDA, we achieve this using the special kernel launch syntax.
When you launch a kernel, the angle brackets <<< >>> let you specify how many threads you want to launch.
But there’s a thing. You can’t just say “launch one million threads”. CUDA breaks the kernel launch into a well defined hierarchy (or a CTA grid as they call it).
- At the top level, you have the Grid
- A Grid is made up of Thread Blocks
- Each Thread Block contains a number of Threads
The important detail is: while you can have as many blocks as you want, each block is limited to a maximum of 1024 threads (You will get an error if you try to make it bigger than that).
So, to handle 1,024,000 elements, we split the work into:
- 1,000 blocks
- 1,024 threads per block
- = 1,024,000 threads in total.
The number of Blocks and the Block size (threads per block) are specified in CUDA’s special kernel launch syntax, inside the angle brackets <<< >>>.
vectorAdd<<<1000, 1024>>>(d_A, d_B, d_C, N);
// 1000 → the number of blocks in the grid
// 1024 → the number of threads in each block

// The syntax is:
kernel_name<<<gridDim, blockDim>>>
// gidDrim  → how many blocks to launch
// blockDim → how many threads in the block (max 1024)
Note: Both gridDim and blockDim can be specified in 1D, 2D, or 3D. This makes it easy to map threads to your data: 1D for vectors, 2D for images, 3D for voxels, and so on.
Then, inside the kernel, each thread figures out “which element am I responsible for?” by combining its block index and thread index. CUDA provides these values as built-in variables (blockIdx, threadIdx, blockDim) that are automatically set by at runtime by the driver + hardware:
// threadIdx.x  → ID of the thread inside its block
// blockIdx.x   → ID of the block inside the grid
// blockDim.x   → number of threads in a block

__global__ void vectorAdd(int* A, int* B, int* C, int N) {
    // Compute the global thread ID
    int i = blockIdx.x * blockDim.x + threadIdx.x;

    // Each thread adds one element
    if (i < N) {
        C[i] = A[i] + B[i];
    }
}
Experimenting with the grid size.
I encourage you to experiment with the concept of grid:
- How many threads are launched in total if you set the thread block size to 512 and launch 2 blocks?
- How many threads are launched if dimGrid = (2, 2) and blockDim = (32, 32)?
- What about dimGrid = (4, 1, 1) and blockDim = (16, 1, 1)?
Profiling with 1M threads
Let’s profile our new approach (using Nsight Compute, again). Select the executable, Start Activity, Select the kernel.
Source code:
#include <iostream>
#include <cuda_runtime.h>


__global__ void vectorAdd(const int* A, const int* B, int* C, int N) {
    int idx = blockIdx.x * blockDim.x + threadIdx.x;
    if (idx < N) {
        C[idx] = A[idx] + B[idx];
    }
}

int main() {
    const int N = 1024000;

    // Host memory allocation
    int* h_A = new int[N];
    int* h_B = new int[N];
    int* h_C = new int[N];

    // Initialize host arrays
    for (int i = 0; i < N; i++) {
        h_A[i] = i;
        h_B[i] = i;
    }

    // Device memory allocation
    int *d_A, *d_B, *d_C;
    cudaMalloc((void**)&d_A, N * sizeof(int));
    cudaMalloc((void**)&d_B, N * sizeof(int));
    cudaMalloc((void**)&d_C, N * sizeof(int));

    // Copy input data from host to device
    cudaMemcpy(d_A, h_A, N * sizeof(int), cudaMemcpyHostToDevice);
    cudaMemcpy(d_B, h_B, N * sizeof(int), cudaMemcpyHostToDevice);

    // Kernel launch configuration
    int blockSize = 1024;
    int numBlocks = (N + blockSize - 1) / blockSize;

    // Launch kernel
    vectorAdd<<<numBlocks, blockSize>>>(d_A, d_B, d_C, N);

    // Copy results back to host
    cudaMemcpy(h_C, d_C, N * sizeof(int), cudaMemcpyDeviceToHost);

    // Free device memory
    cudaFree(d_A);
    cudaFree(d_B);
    cudaFree(d_C);

    // Free host memory
    delete[] h_A;
    delete[] h_B;
    delete[] h_C;

    return 0;
}
0.02ms!!! That, from 50ms. Huge improvement, right?
But here’s something that you might find interesting:
- If I set the thread block size to 256 (instead of 1024), the result is actually slightly faster
- If I set the thread block size to 32, the result becomes a bit worse
So, the thread block size matters for performance. It isn’t just a software concept — it ties directly into the GPU hardware itself. We’ll dig deeper into why this happens in the following articles.
| Test Scenario | Duration |
|---|---|
| 1 CPU thread | 1 ms |
| 1 GPU thread | 50 ms |
| 1M GPU threads, block size = 1024 | 0.020 ms |
| 1M GPU threads, block size = 256 | 0.018 ms |
| 1M GPU threads, block size = 32 | 0.022 ms |
The difference isn’t very big here, but our use case is also super simple. In more complex scenarios, thread block size can have a much greater impact on performance.
Debugging multiple threads
Let’s now see what happens when we run multiple threads and how we can debug them. For simplicity, I’ll reduce the number of threads we launch to 128, split into 4 blocks of 32 threads.
+   const int N = 128;  // number of elements
+   const int THREADS_PER_BLOCK = 32;
    const int blocks = (N + THREADS_PER_BLOCK - 1) / THREADS_PER_BLOCK;
    vectorAdd <<<blocks, THREADS_PER_BLOCK>>> (d_A, d_B, d_C, N);
Next, I’ll add a breakpoint and attach the CUDA Debugger. Now, if you open Nsight → Windows, you’ll notice some interesting options. One of them is the Warp Info Window. Let’s open it—but first, a quick detour.
What is a warp?
In short, a warp is a group of 32 threads that always execute the same instruction. That’s how GPUs work under the hood: they split the threads we launch into fixed-size chunks of 32. We’ll talk more about warps later, but for now just keep this in mind.
Warp Info Window
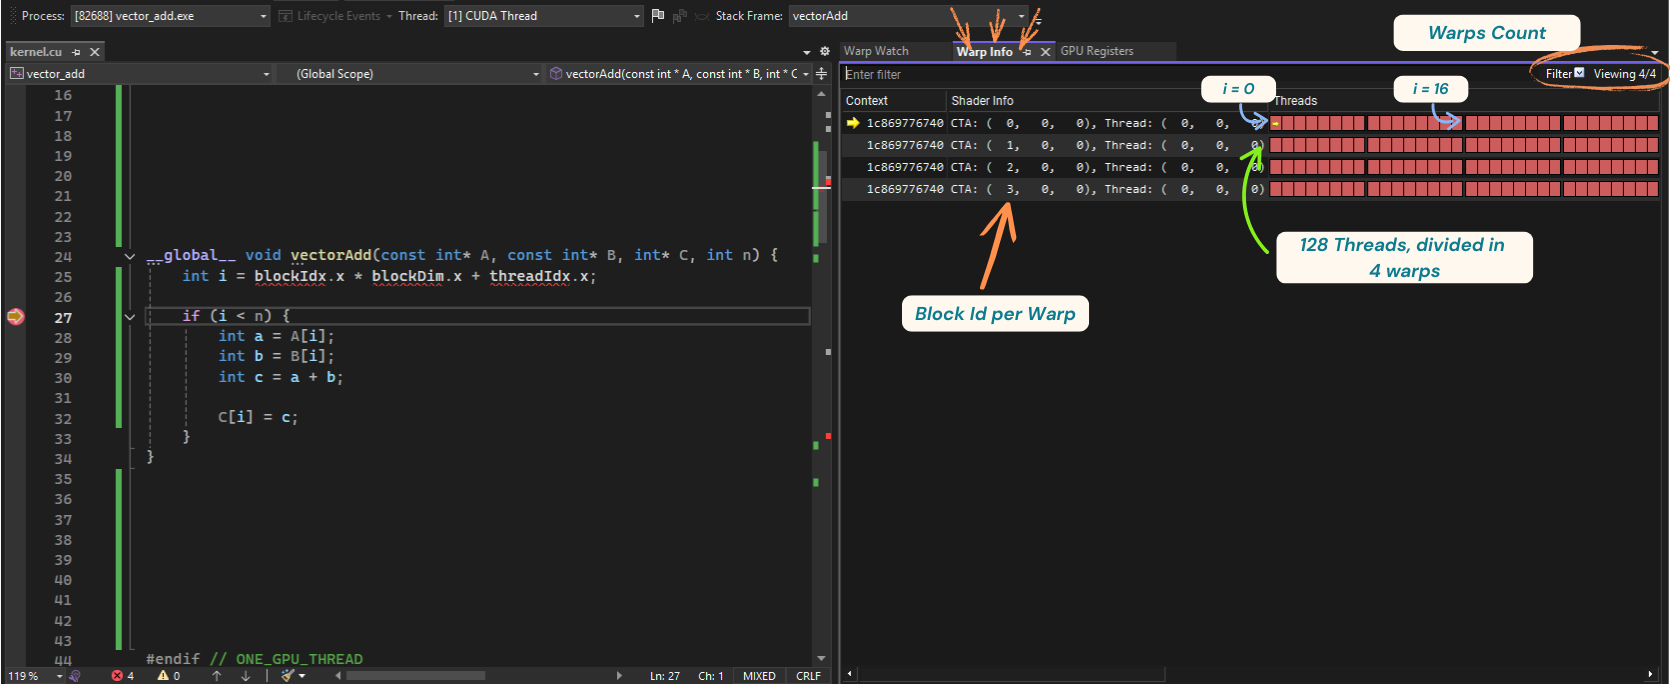
Warp info window
The Warp Info Window shows a few interesting things:
- The number of warps currently running (that’s top right of the window): In our case, it’s 4. We launched 128 threads (4 blocks × 32 threads), which maps to 4 warps
- Then, we have the “Shader Info”, showing the id of the block each warp belongs to. Here it’s simple: one warp (32 threads) per block, so warp IDs map perfectly to block IDs: 0, 1, 2, 3
- Next, in the “Threads” section we can see all the 32 threads that are part of a warp. You’ll also see a little yellow arrow indicating the active thread you’re currently debugging. You can double-click on any rectangle to switch threads and see how variables (like i) change
Warp Watch Window
Let’s now inspect the Warp Watch Window.
This window is even cooler: it shows the values of your variables across the entire warp—all 32 threads.
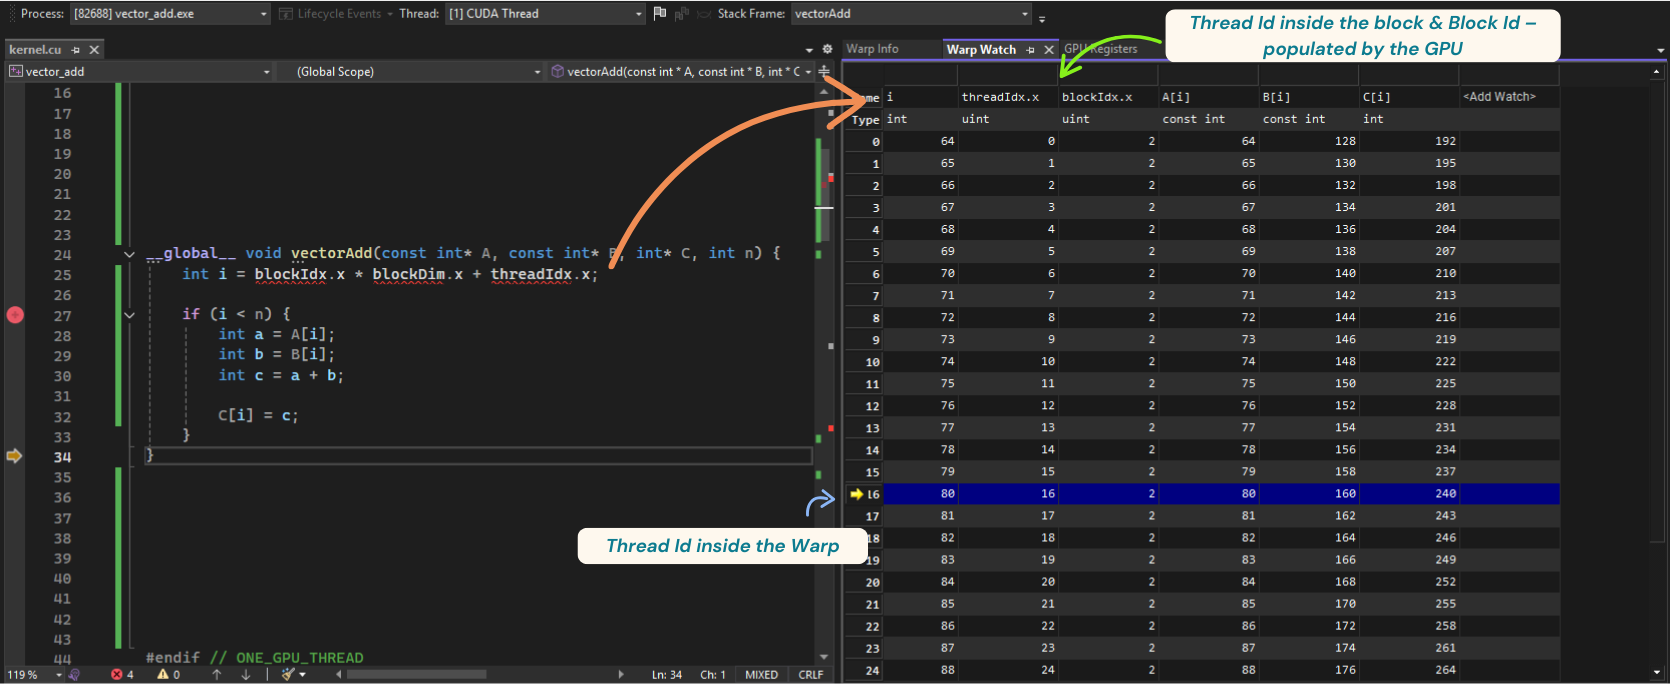
Warp watch window
For example, here I’m debugging the thread with index 80 in our grid. Notice how:
blockId.x = 2threadId.x = 16(inside its block, which matches the warp size)- So
i = blockId.x * blockDim.x + threadId.x = 2 * 32 + 16 = 80
if you check the arrays, you can see the results of the additions for elements A and B.
PS: Try experimenting with different configurations:
- Use a thread block size of 64 and see how the block IDs change
- Run just one thread—what happens then?
- Add a branch like if (i < 16) and watch what happens when not all threads in a warp take the same path (this is called divergence)
So, behind the scenes, the GPU groups threads into warps, which adds another hidden layer to our launch hierarchy:
Grid → Blocks → Warps → Threads
Next, let’s dig into why GPUs do this.
GPU Architectures
We’ve now seen how to program the GPU, but let’s take a step back and understand how they actually work under the hood. Whether it’s pixels, matrix multiplications, or signal processing, the GPU’s main bet is that the same instruction will be performed on many data elements at once. To achieve this efficiently, GPUs use some execution units specialized exactly for this type of operation.
Understanding SIMD Architecture
At the core of GPU hardware stands the SIMD unit — Single Instruction, Multiple Data. A SIMD unit is essentially an array of cores controlled by a single instruction pointer.

SIMD Unit
It is important to understand that the same instruction is shared by all the cores in the SIMD unit, because it means that all the threads mapped to these cores will always execute the same instruction. This is different from a traditional multi-core CPU, where each core has its own instruction stream and can execute different instructions independently.
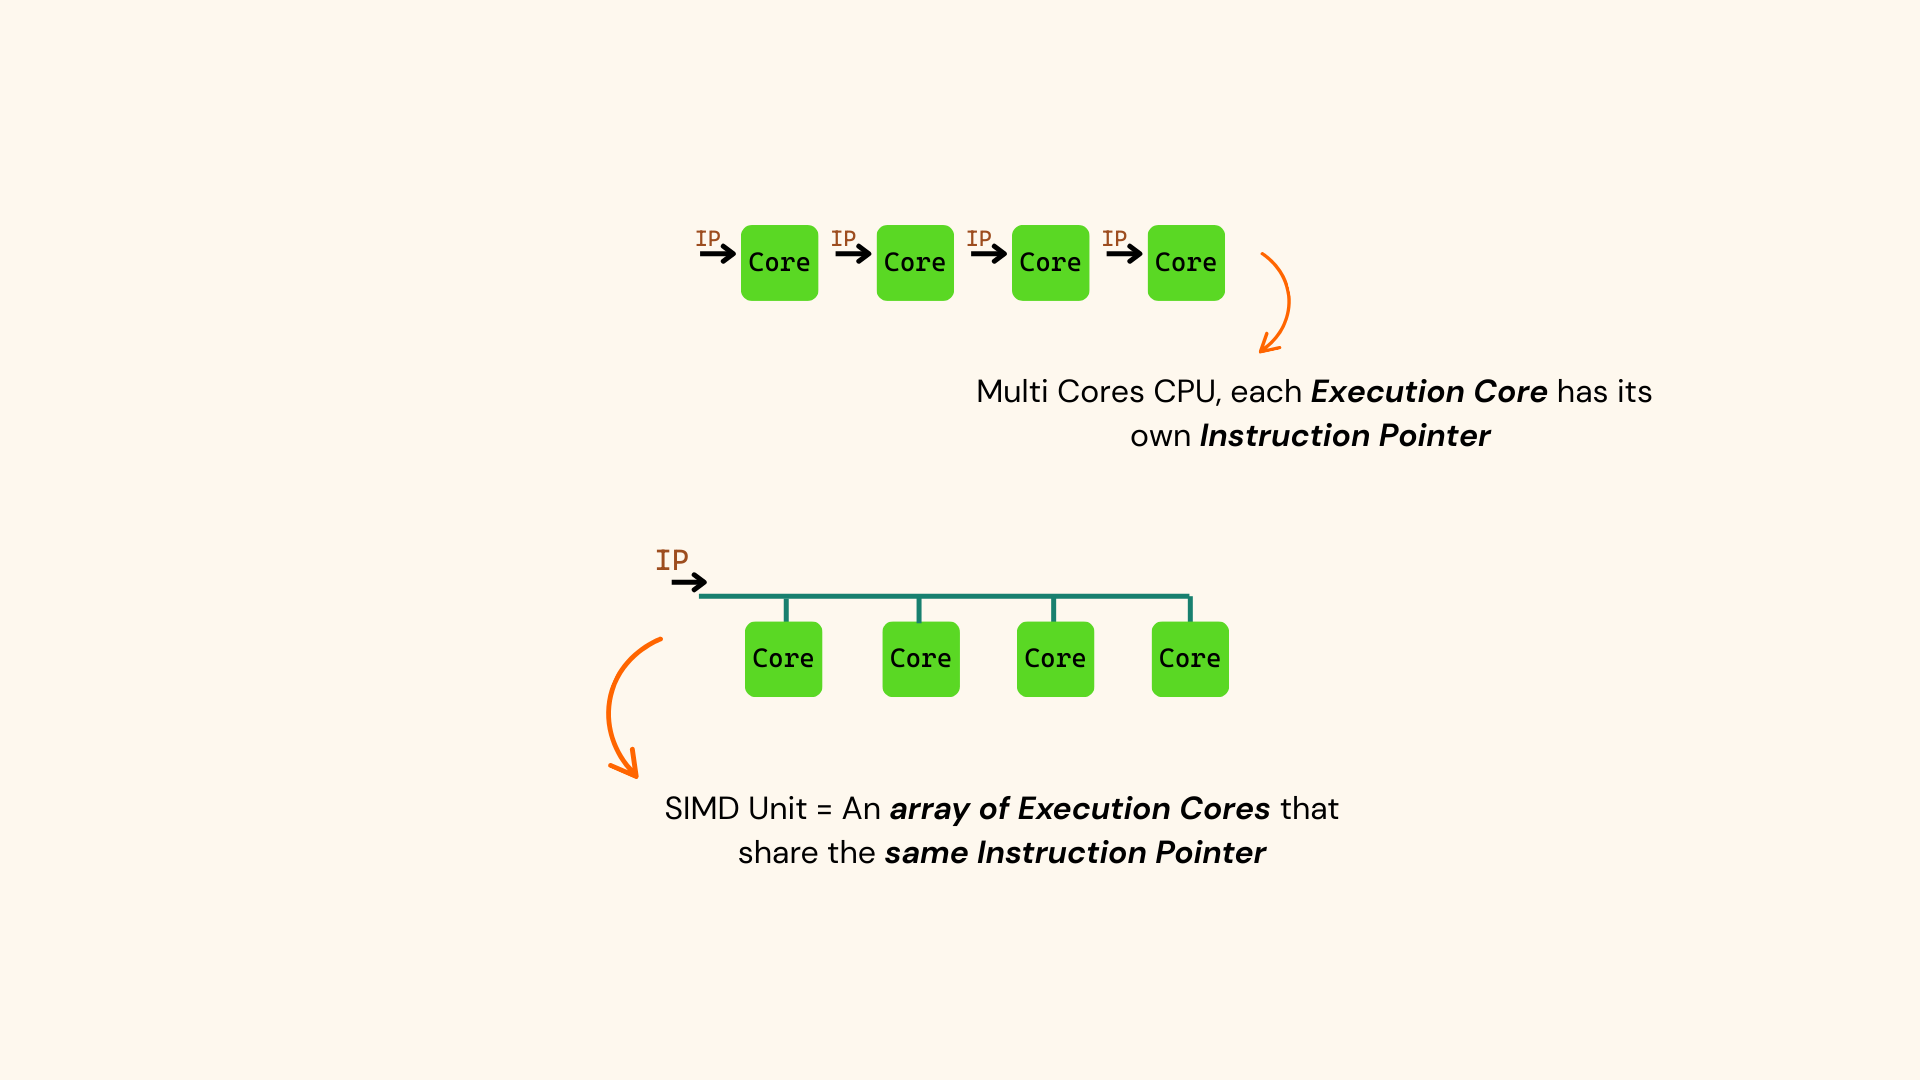
Multi Core CPU vs SIMD Unit
Remember, the GPU’s design is based on the assumption that the same instruction will be executed across many data elements. So, instead of managing each thread individually (which might get expensive in terms of performance), threads are packed into groups of N, where N is the number of cores in a SIMD unit (also referred to as the vector length).
Now, in practice, SIMD Units don’t have just 4 Cores, as in my drawings— they typically have 32 cores (*). This means that threads are grouped into chunks of 32. NVIDIA calls this set of 32 threads a warp.
Warps
A warp is a set of 32 threads that run the same instruction at the same time. These warps are executed on the GPU’s SIMD units.

Warps, explained
But, as you may have noticed, as a programmer, you don’t work directly with warps when writing CUDA code—the hardware and driver handle that for you. The work (threads) you launch to the GPU is automatically grouped into warps behind the scenes. However, understanding how warps work is crucial if you want your code to run efficiently. For example:
- Warp divergence—when threads in the same warp follow different execution paths—can lead to major performance issues
- Intra-warp instructions (like shuffle and ballot) allow threads within a warp to share data efficiently
We will discuss more about these concepts in future posts.
To summarize:
- A SIMD unit contains multiple cores sharing one instruction pointer
- Threads are grouped into warps of 32, and all 32 threads in a warp run in lockstep
- This simplifies hardware design
- managing groups of 32 threads is easier than managing thousands individually
- It makes instruction dispatch and fetch cheaper and easier to optimize—one instruction per warp instead of one per thread
Recap on launch hierarchy
We’ve seen that on the software side, we launch threads in blocks, and multiple blocks form a grid.
But the thread block’s threads are actually split into warps by the driver & the hardware.
The hierarchy is:
Grid → Block → Warp → Thread
You might wonder why we even need the concept of a thread block. The answer lies in the hardware itself—SIMD units play a key role in how threads are grouped and executed.
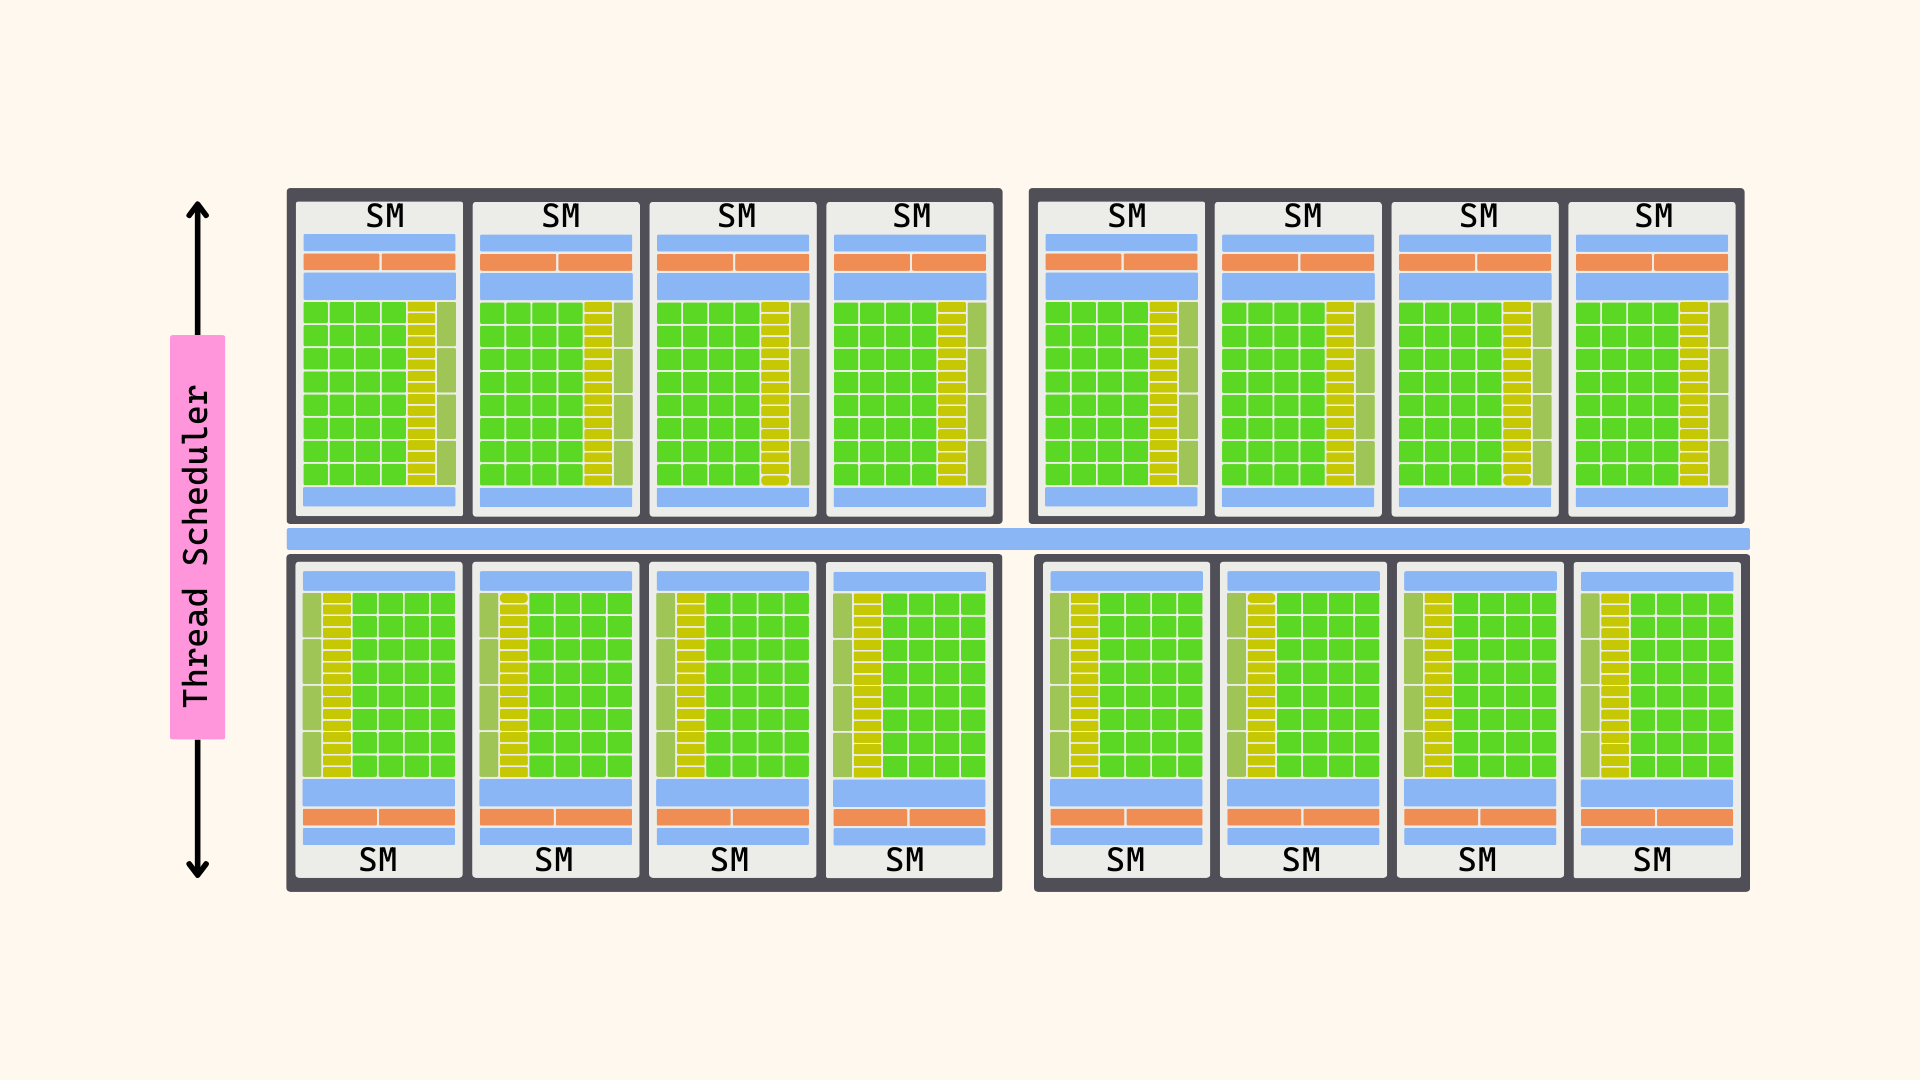
NVIDIA Streaming Multiprocessor
In practice, real-world SIMD units are far more complex than our simple conceptual model and come with many more capabilities. A well-known example is NVIDIA’s Fermi Streaming Multiprocessor (2010):

NVIDIA Fermi's Streaming Multiprocessor
Some important characteristics of the Streaming Multiprocessor (SM):
- It can keep up to 48 warps in flight. These are warps that have been scheduled to the SM and are ready to execute. The Dispatch Units choose what warps to execute each cycle
- Warps execute on one for the 4 Execution Blocks; Each execution block is specialized for certain instruction types. You can think of an execution block as a SIMD unit, where multiple cores execute the same instruction together
- Having 4 Execution Block means that 4 warps can execute at the same time on a SM
- Each SM also comes with a Shared Memory block—a small, on-chip memory that enables fast communication between threads in a thread block. This is exactly why we have the software concept of a thread block: an SM can’t keep an infinite number of threads in flight at once, and we want to maximize the use of this very fast memory. For that reason, GPU architectures tie Shared Memory to a thread block (and also impose a maximum size limit).
Of course, things are much more complex than that-I just wanted to give you a feel for what a real SIMD Unit looks like. In future articles we’ll dig into how warps compete over SM resources and how code that ignores hardware capabilities can degrade performance.
One more thing to mention: GPUs don’t have just one SM; they have many. For example, Fermi (2010, so pretty old) had 16 SMs. If we calculate the maximum potential threads in flight at the same time, we get: 16 SMs × 48 warps × 32 threads = 24,576 threads potentially in flight
That’s a lot. However, on newer architectures (like Hopper, 2022), we have up to 144 SMs, and each SM can hold up to 64 warps in flight: 144 SMs × 64 warps × 32 threads = 294,912 threads potentially in flight
So, an order of magnitude bigger.
NVIDIA Fermi Architecture
That being said, we’ve covered a lot! We explored how to use CUDA to run code on the GPU, learned about CUDA’s thread hierarchy and how threads are launched, looked at profiling and debugging techniques, and touched on some of the theory behind GPU architectures—from SIMD units and warps to NVIDIA’s Streaming Multiprocessors.
In the next articles, we’ll dive deeper into techniques for writing high-performance GPU code while keeping hardware capabilities in mind. Meanwhile, I’ll share a list of useful resources to help you continue learning. Thank you for reading!
Resources
| Resource | Description |
|---|---|
| ETH Zurich GPU Architecture & Programming (YouTube) | Excellent lecture series on GPU hardware and programming. The first two lessons cover SIMD units and a CUDA intro — highly recommended! |
| NVIDIA Tesla Whitepaper | Release paper for the Tesla architecture — the first CUDA-enabled GPU with Streaming Multiprocessors. Great historical insight. |
| CUDA C++ Programming Guide | Official NVIDIA documentation for CUDA C++, the go-to reference for any CUDA developer. |
| Zen vs CUDA Cores (Computer Enhance) | A comparison between AMD Zen4 CPU cores and NVIDIA Ada CUDA cores, showing architectural differences. |
| NVIDIA Donut Samples | NVIDIA Donut is a graphics API abstraction framework that supports DirectX, Vulkan, and OpenGL. If you want to experiment with compute using graphics APIs, this is a great starting point. Keep in mind, though, that the setup differs from CUDA: you can’t just mix CPU and GPU code in the same file. Instead, you’ll need to separate them, compile GPU code with the right compiler, and then use dispatch functions to launch work on the GPU. |
| NVIDIA CUDA Samples | Probably the best repository for learning CUDA. It’s packed with examples, covering everything from the basics to advanced features. Highly recommended if you want hands-on learning. |